Eirik Solheim
-
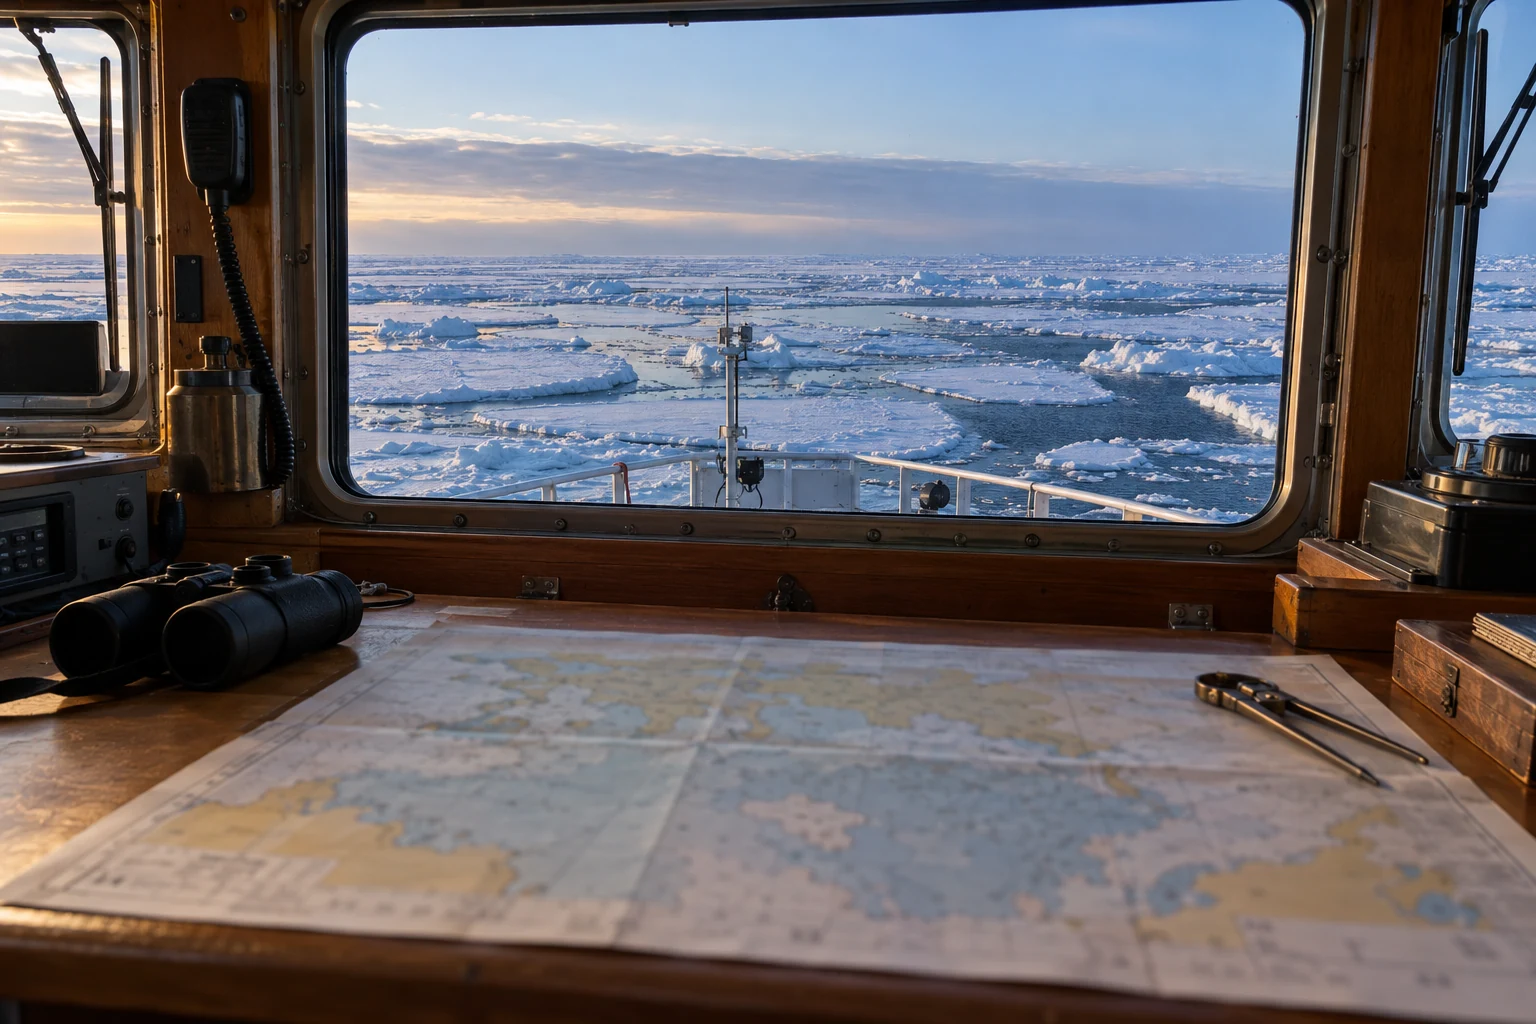
What an ice chart cannot promise
Valid times, egg codes, partial concentrations, and chart coverage matter. Learn why a regional ice analysis cannot guarantee route connectivity, local strength, or a safe journey.
-
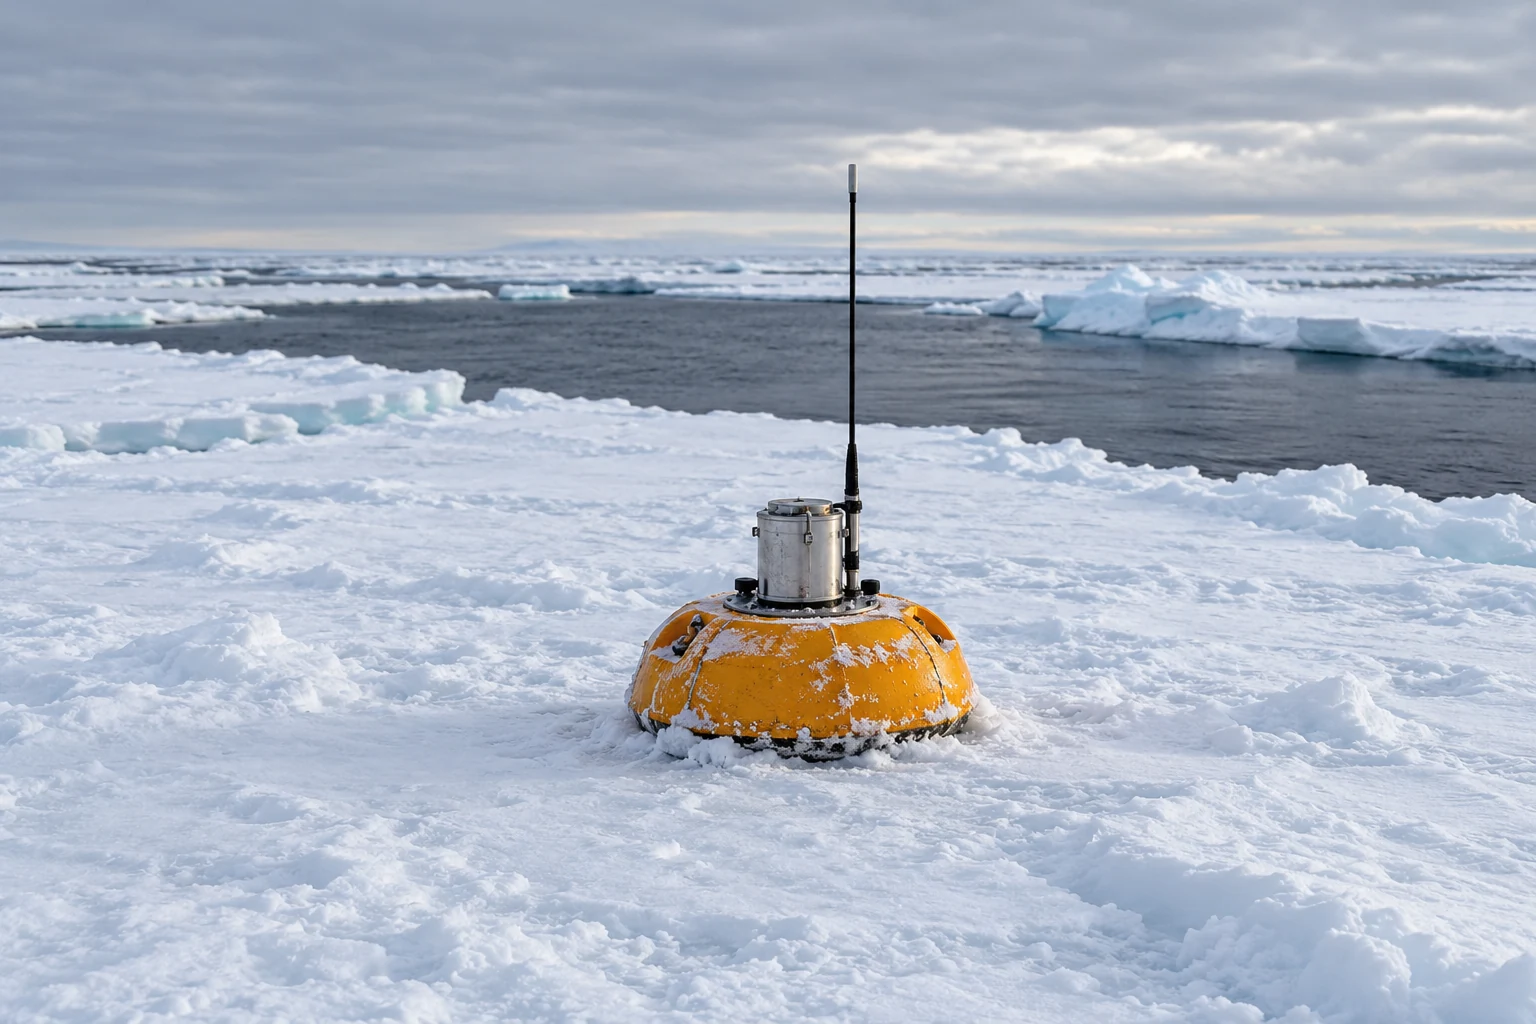
A drifting instrument is not a fixed station
A rising temperature line may record movement through a water-mass boundary. Following position, depth, and salinity helps distinguish spatial structure from change through time.
-
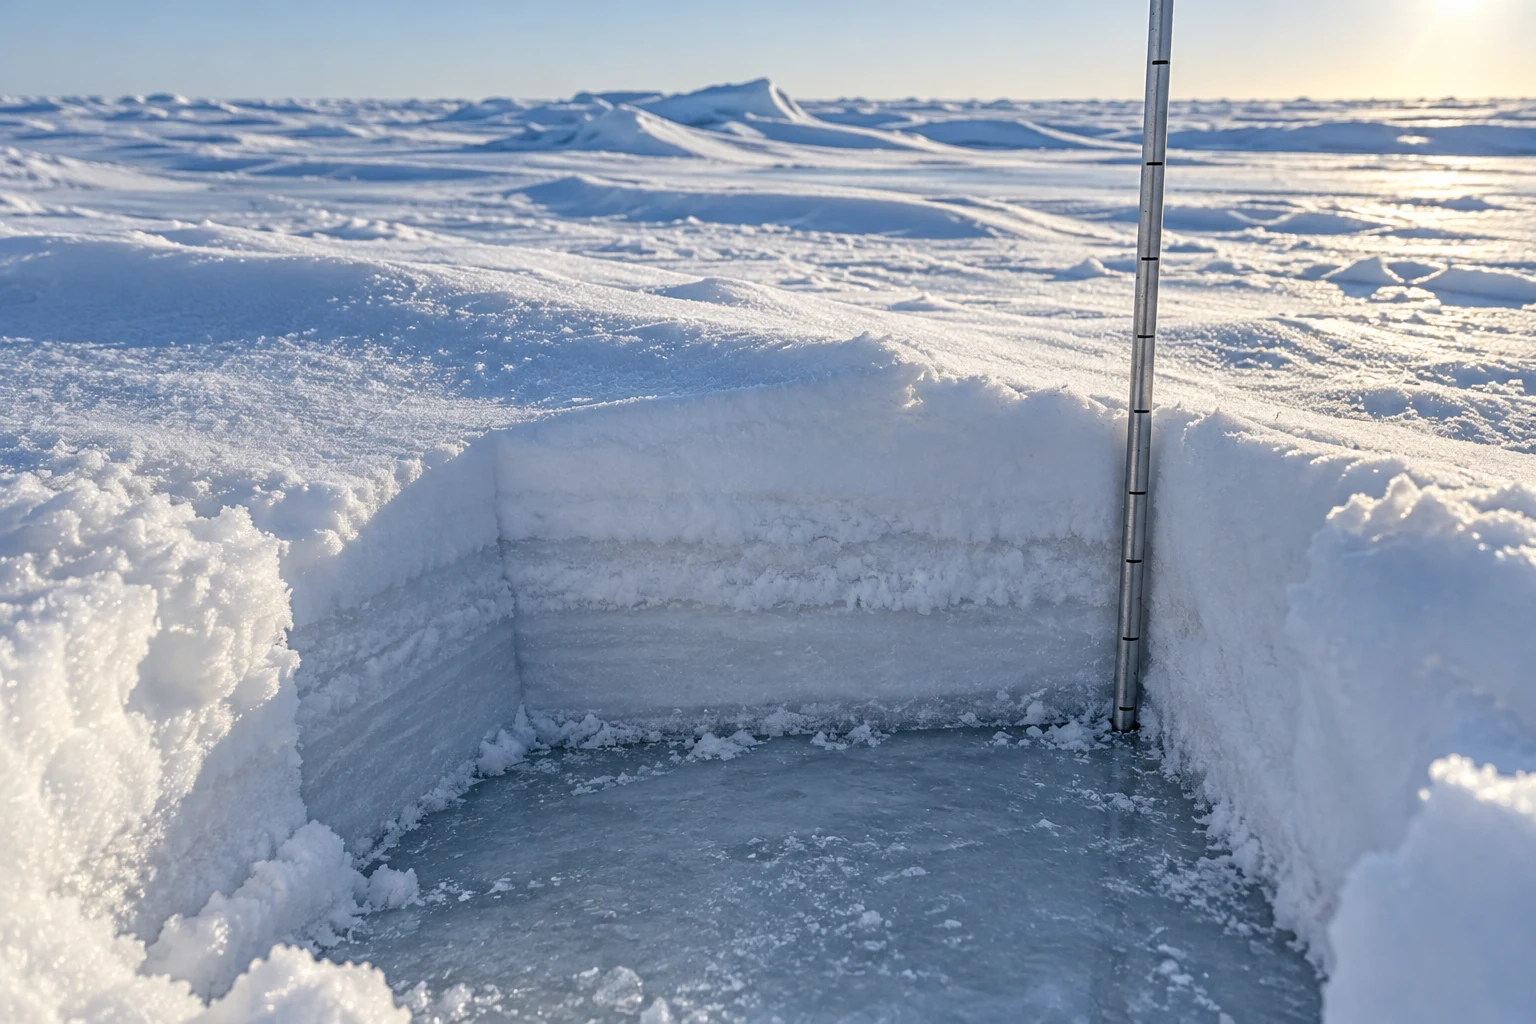
Snow on sea ice has two seasons
Why a snow blanket can slow winter ice growth yet delay spring melt, and why depth, density, timing, and wind redistribution belong in the comparison.
-
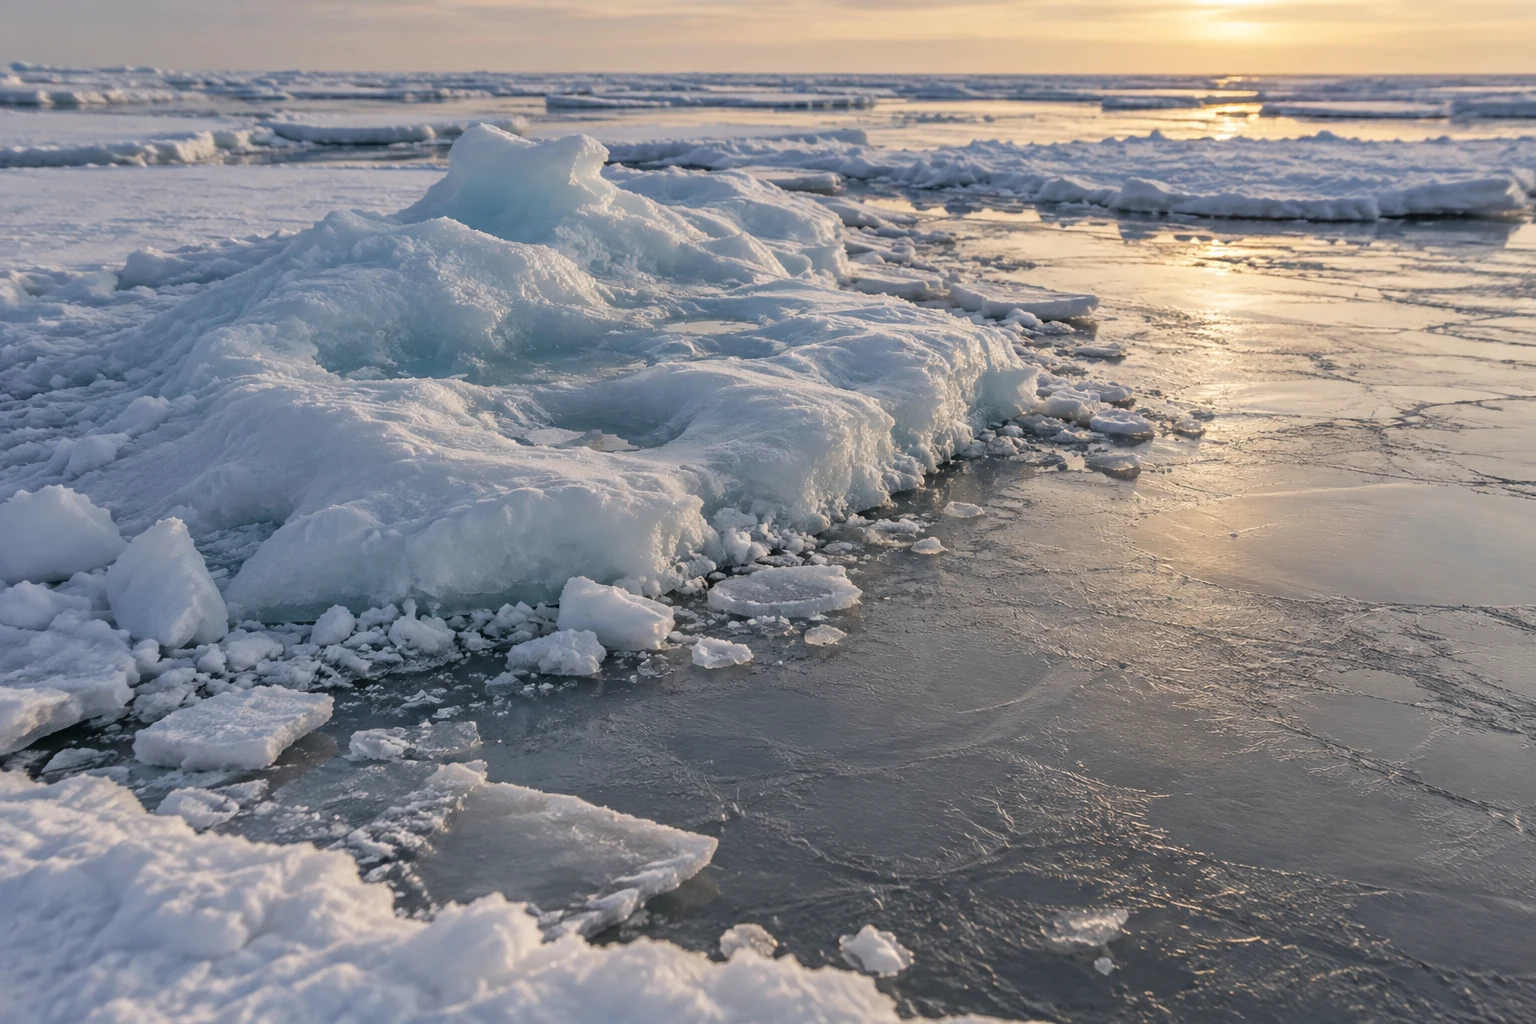
How old is that sea ice?
Ice-age colours track survival and movement, not every floe’s thickness. Learn what the oldest category in a grid cell reveals, conceals, and cannot promise.
-
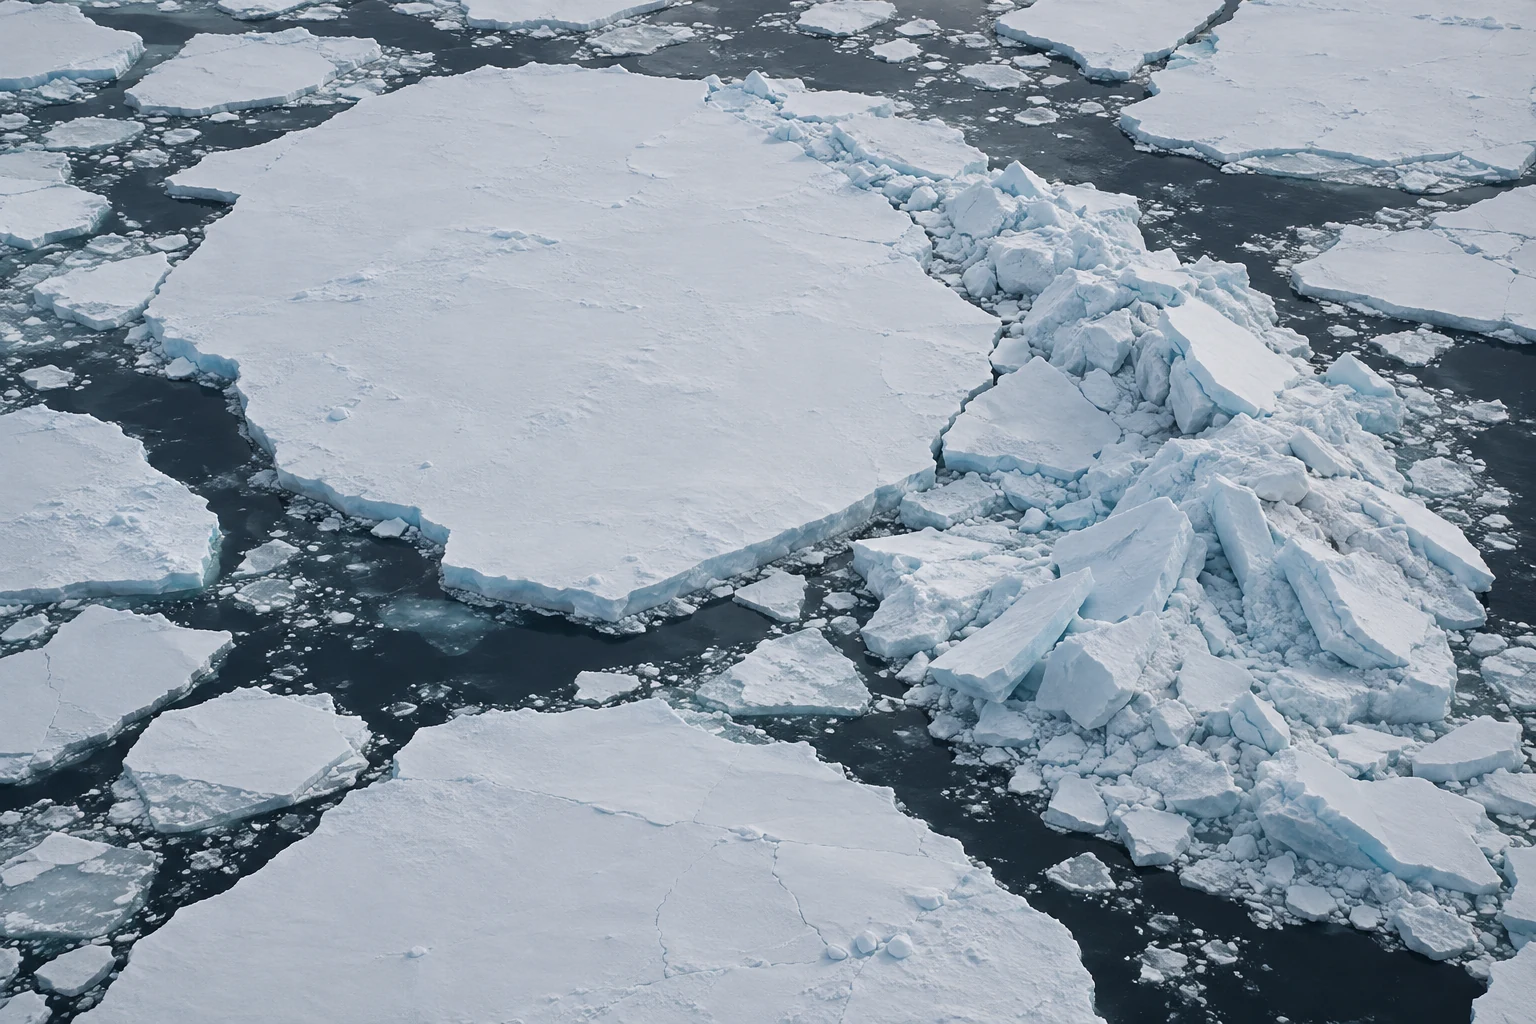
Extent and volume tell different ice stories
A worked example separates extent, area, and volume, then shows why wind, thickness estimates, seasonal timing, and model uncertainty can make ice graphs tell different stories.
-
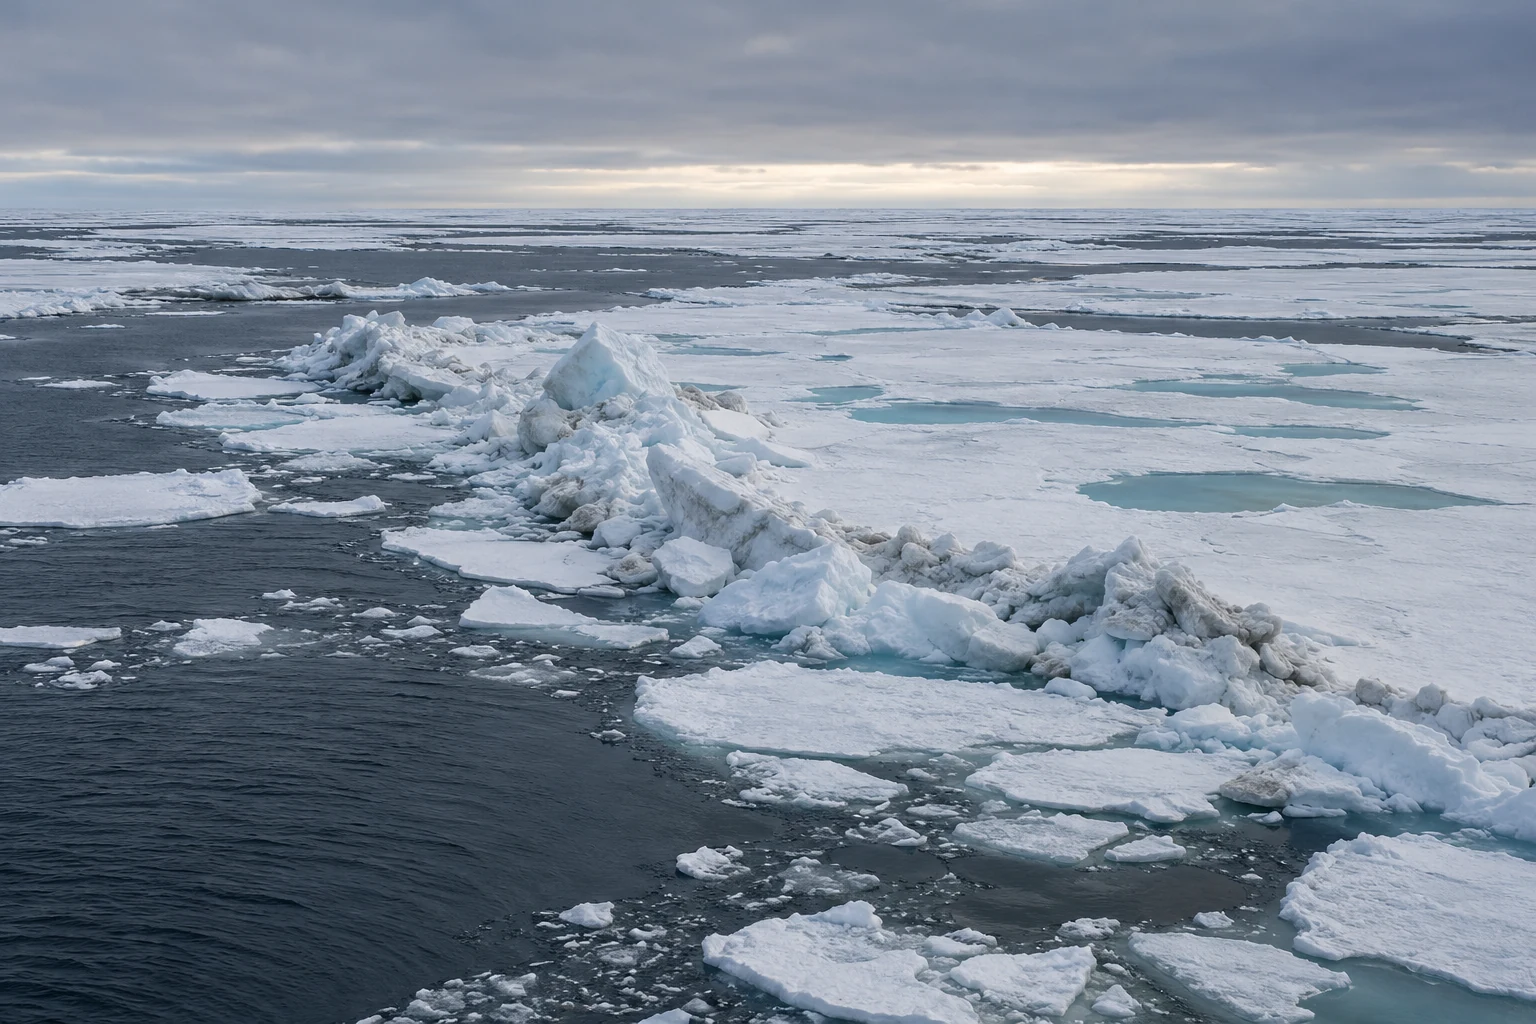
At the ice edge north of Svalbard
A careful reading of melt ponds, pressure ridges, kittiwakes, wildlife distance, and younger sea ice.